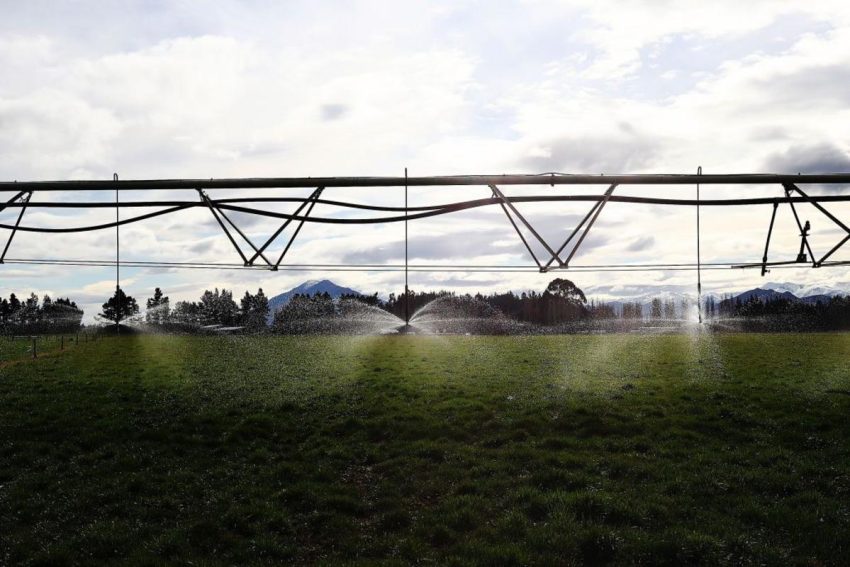
According to the Bureau of Reclamation, water supplies for irrigation remain tight, and for junior districts, not much improvement.
Will We Have Much Water rest of Season?
The Bureau is the Federal agency, part of the Department of the Interior, who oversees water supplies and storage throughout the US, including the PNW and WA state.
The latest August report for what’s called the Yakima Basin, which also includes SE WA and Tri-Cities, remains a little grim. According to the Bureau on Thursday August 6:
“Storage in the Yakima basin reservoirs on Aug. 1 was 57% full with 605,000 acre-feet, which is 80% of average. Precipitation for July was 36% of average and for October–July was 112% of average. On Aug. 1, the amount of water in the snowpack, known as snow water equivalent, was 0% of average.”
So, what Does That Mean for Us?
Senior water rights holders, such as Columbia Irrigation in Tri-Cities will still get 100 percent of their allocated water. However, junior districts such as KID and Roza (who serves from Yakima Valley to Benton City) will only get 58 percent of their normal allocations.

That’s why KID and others are strongly urging people follow the limited schedules they have posted on their website, Instead of soaking every day, limited to 3 days a week.
The Pasco Irrigation District, serving the city, does not qualify, they pull their water from the Columbia. The South Columbia Basin Districdt, which serves Adams, Grant and other nearby counties, is not a junior District.
In the End, Tri Cities, Be Careful
So in the end, if you’re a Roza or KID Customer, get used to watering sparingly the rest of the summer. But, no mention of cutoffs was made in the report.
LOOK: The most extreme temperatures in the history of every state
Keep reading to find out individual state records in alphabetical order.
Gallery Credit: Anuradha Varanasi